Data & AI

Data Analytics

Turn Raw Data into Meaningful Business Insights

Learn how to collect, clean, analyze, visualize, and interpret data to uncover trends, identify patterns, and support data-driven decision-making.

Develop practical analytics skills using Excel, SQL, Python, Pandas, and data visualization tools while working with real-world datasets and business scenarios.

Data Analytics

ConsivoX Certified

16 Modules • Live Mentorship

Course Highlights

Duration

16 – 32 Hours

Learning Tracks

Foundation • Professional • Advanced

Level

Beginner to Advanced

Curriculum Scope

16 Modules • Live Mentorship

Practical Focus

Hands-On Case Studies & Labs

Hands-On

Live & Capstone Development

Outcome

Real-World Production Projects

Credential

Certificate of Completion

Core Outcomes

What You'll Learn

Key Competencies
Data Analytics fundamentals
Data analysis workflow
Microsoft Excel for analytics
Data cleaning and preparation
SQL fundamentals
SQL filtering and aggregation

Why Learn Data Analytics?

Organizations generate large amounts of data every day. Data Analytics helps transform that raw information into useful insights that support business and operational decisions.

Industry-Aligned Curriculum

Gain practical mastery of Data Analytics concepts matching modern production standards.

Hands-On Project Building

Develop production-grade applications and case studies directly for your professional portfolio.

Career & Interview Readiness

Acquire the technical confidence and problem-solving skills required for high-impact roles.

FLEXIBLE FORMATS

Data Analytics — Modes of Learning

Choose the learning mode that fits your schedule, lifestyle, and career goals with hands-on practice built in.

16 Hours

Foundation

₹5,500 • 16 Hours

Master essential foundations with live instructor-led sessions, 6-month LMS access, and core learning materials.

16+ Hours of Live Instructor-Led Sessions
LMS Access for 6 Months
Course Materials & Learning Resources
Most Popular

Professional

₹7,500 • 24 Hours

Elevate your practical skills with 1:1 doubt clearing sessions, dedicated mentor support, and extended lab work.

24+ Hours of Live Instructor-Led Sessions
One-on-One Doubt Clearing Sessions
LMS Access for 6 Months
Dedicated Mentor Support
Career Track

Advanced

₹9,000 • 32 Hours

Comprehensive career masterclass featuring extensive live sessions, 1:1 mentor syncs, interview prep, and placement guidance.

32+ Hours of Live Instructor-Led Sessions
One-on-One Doubt Clearing Sessions
LMS Access for 6 Months
Dedicated Mentor Support
Placement Guidance
Interview Assistance
STRUCTURED ROADMAP

Data Analytics Curriculum

Step-by-step learning progression designed for practical mastery, from fundamentals to production-ready deployment.

16 Modules16+ Hours Live & Hands-On

Key Concepts Covered:

  • What is Data Analytics?
  • Data Analytics vs Data Science
  • Types of Data
  • Data Analytics Lifecycle
  • Real-World Applications of Data Analytics

Key Concepts Covered:

  • Excel Data Organization
  • Formulas and Functions
  • Sorting and Filtering
  • Conditional Formatting
  • Basic Data Analysis with Excel

Key Concepts Covered:

  • Understanding Data Quality
  • Handling Missing Values
  • Removing Duplicates
  • Data Formatting and Transformation
  • Preparing Data for Analysis

Key Concepts Covered:

  • Lookup Functions
  • IF and Logical Functions
  • Aggregation Functions
  • Pivot Tables
  • Pivot Charts

Key Concepts Covered:

  • Introduction to SQL
  • Databases and Tables
  • SELECT Statements
  • WHERE Conditions
  • ORDER BY and LIMIT

Key Concepts Covered:

  • COUNT, SUM and AVG
  • MIN and MAX
  • GROUP BY
  • HAVING
  • Analytical SQL Queries

Key Concepts Covered:

  • Understanding Table Relationships
  • INNER JOIN
  • LEFT JOIN
  • Subqueries
  • Combining Multiple Tables

Key Concepts Covered:

  • Python Fundamentals for Analytics
  • Variables and Data Types
  • Lists and Dictionaries
  • Conditions and Loops
  • Functions and Basic Data Processing

Key Concepts Covered:

  • NumPy Arrays
  • Pandas Series and DataFrames
  • Loading Datasets
  • Selecting and Filtering Data
  • DataFrame Operations

Key Concepts Covered:

  • Understanding EDA
  • Dataset Exploration
  • Descriptive Analysis
  • Identifying Patterns and Outliers
  • Generating Analytical Insights

Key Concepts Covered:

  • Mean, Median and Mode
  • Range and Variance
  • Standard Deviation
  • Percentiles and Quartiles
  • Interpreting Statistical Results

Key Concepts Covered:

  • Data Visualization Fundamentals
  • Bar and Column Charts
  • Line Charts
  • Histograms and Scatter Plots
  • Choosing the Right Visualization

Key Concepts Covered:

  • Dashboard Fundamentals
  • KPIs and Business Metrics
  • Dashboard Layout and Design
  • Interactive Filters
  • Building Basic Analytical Dashboards

Key Concepts Covered:

  • Understanding Business Questions
  • KPI Analysis
  • Trend Analysis
  • Comparative Analysis
  • Converting Data into Business Insights

Key Concepts Covered:

  • Problem Definition
  • Dataset Collection and Preparation
  • Data Cleaning and Analysis
  • Visualization and Dashboard Development
  • Business Insight Generation
  • Practical Project
  • Sales Performance Analytics Dashboard
  • Analyze sales data to understand revenue, products, customers, regions, and business performance.
  • Project Workflow
  • Raw Data → Cleaning → SQL/Python Analysis → KPIs → Visualization → Dashboard → Business Insights

Key Concepts Covered:

  • End-to-End Data Analytics Workflow
  • Analytical Problem Solving
  • Dashboard and Insight Presentation
  • Data Analyst Interview Preparation
  • Data Analytics Career Roadmap
  • Final Activity
  • Complete an end-to-end analytics case study involving data cleaning, SQL analysis, visualization, KPI analysis, dashboard creation, and presentation of business insights.

Everything You Need to Master Data Analytics

Comprehensive technical foundation, modern tooling, and production workflows packed into a focused, hands-on curriculum.

Data Analytics Fundamentals

Master core Data Analytics principles, scalable architectures, and practical techniques.

Excel Analytics

Understand the complete process of collecting, preparing, analyzing, visualizing, and communicating data.

SQL Practice

Use formulas, functions, filtering, Pivot Tables, and Pivot Charts for practical data analysis.

Python for Analytics

Write SQL queries to retrieve, filter, aggregate, join, and analyze relational data.

Data Cleaning

Use Python and Pandas to process and analyze datasets efficiently.

Exploratory Data Analysis

Learn how to handle missing values, duplicates, inconsistent formats, and common data-quality issues.

Real-World Projects You'll Build

Build production-grade applications that demonstrate your skills to engineering recruiters and hiring managers.

Capstone SpotlightData & AI Project

Sales Performance Analysis

Build

Key Features:

  • Analyze sales data to understand revenue and business performance.
  • Revenue analysis
  • Product performance
  • Regional performance
  • Monthly trends
  • Customer analysis
  • KPI calculations
Data AnalyticsConsivoXPortfolio
Production Ready
Project 02Data & AI Project

Customer Analytics

Build

Key Features:

  • Analyze customer data to understand customer behavior and purchasing patterns.
  • Customer segmentation
  • Purchase analysis
  • Customer trends
  • Repeat customer analysis
  • Revenue contribution
  • Business insights
Data AnalyticsConsivoXPortfolio
Production Ready
Project 03Data & AI Project

Employee Analytics

Build

Key Features:

  • Analyze employee data to identify workforce trends and organizational patterns.
  • Employee demographics
  • Department analysis
  • Salary analysis
  • Attrition analysis
  • Performance trends
  • HR KPIs
Data AnalyticsConsivoXPortfolio
Production Ready
Project 04Data & AI Project

E-Commerce Analytics Dashboard

Build

Key Features:

  • Create an analytical dashboard for an e-commerce business.
  • Sales KPIs
  • Product performance
  • Customer analysis
  • Order trends
  • Revenue analysis
  • Interactive dashboard
  • FINAL PROJECT — Complete Data Analytics Challenge
  • Complete an end-to-end business analytics project using:
  • Data Collection → Data Cleaning → SQL Analysis → Python/Excel Analysis → KPI Calculation → Visualization → Dashboard → Business Insights → Presentation
  • The final project can serve as a practical demonstration of the learner's Data Analytics capabilities.
Data AnalyticsConsivoXPortfolio
Production Ready
OFFICIAL CREDENTIALS

Government Recognized Industry Certification

Earn authentic, verifiable credentials recognized by industry leaders and verified via Startup India, MSME, and the Ministry of Corporate Affairs.

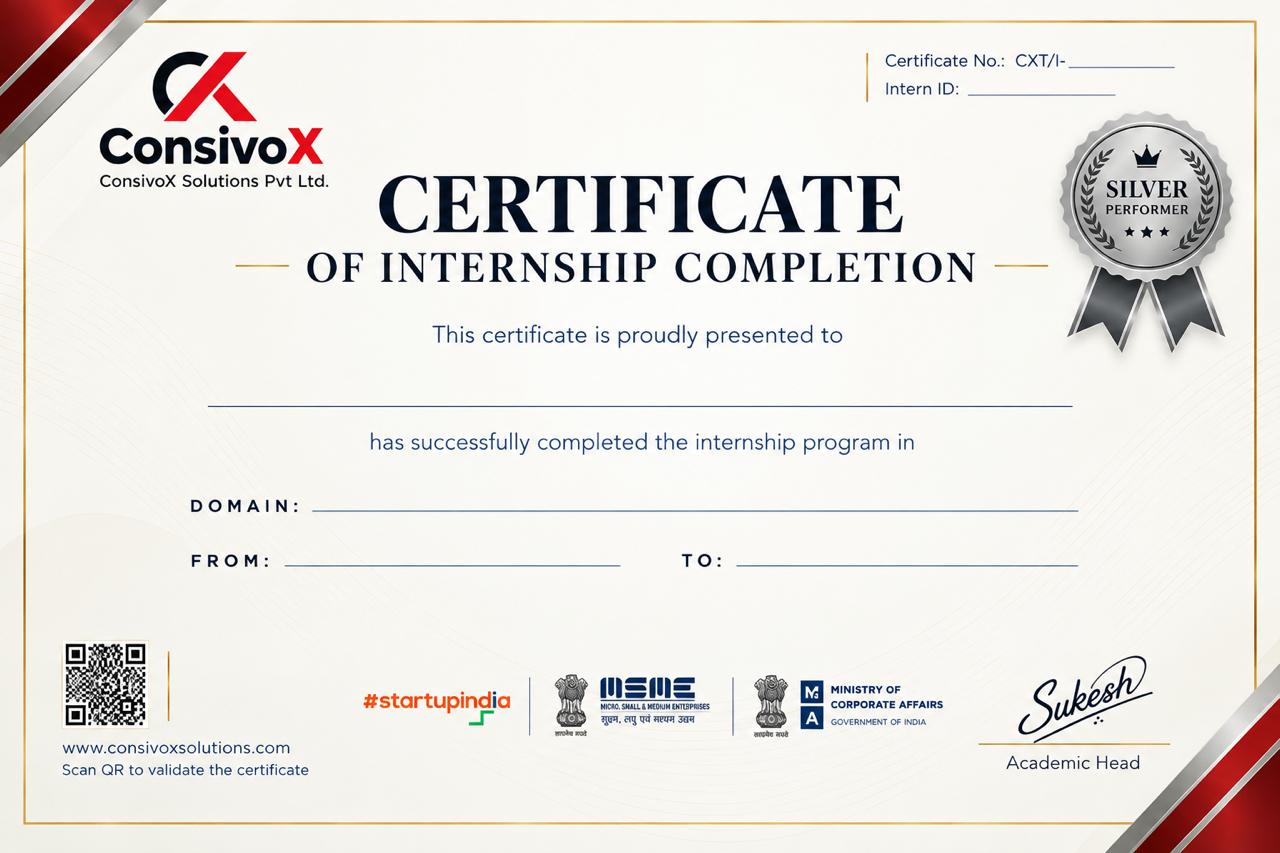
TIER 01 • Silver PerformerSilver Performer

Silver Certificate

Validates core engineering fluency, active internship engagement, and successful project submissions.
100% completion of course modules & domain internship tasks
Practical evaluation across live project milestones
Code submissions reviewed and approved by mentors
Unique QR code verification valid for lifetime authentication
Verified Internship Credential & LinkedIn Badge
Silver Certificate — ConsivoX Solutions
View Full Certificate
Official QR & Govt. AccreditedClick to Enlarge

Government & Corporate Recognition

Accredited under Startup India, MSME, and Ministry of Corporate Affairs.

Verifiable Dynamic QR Code

Instant online validation for recruiters and hiring managers.

LinkedIn One-Click Integration

Seamlessly showcase verified credentials on your professional profile.

Chat on WhatsApp